
Case Study - Cangshan: 39.6% higher conversion rate after its Shopify launch
Net sales up 23.8% in the first 30 days, even with 21.4% fewer sessions.
- Client
- Cangshan Cutlery
- Year
- Service
- Shopify CRO and storefront build
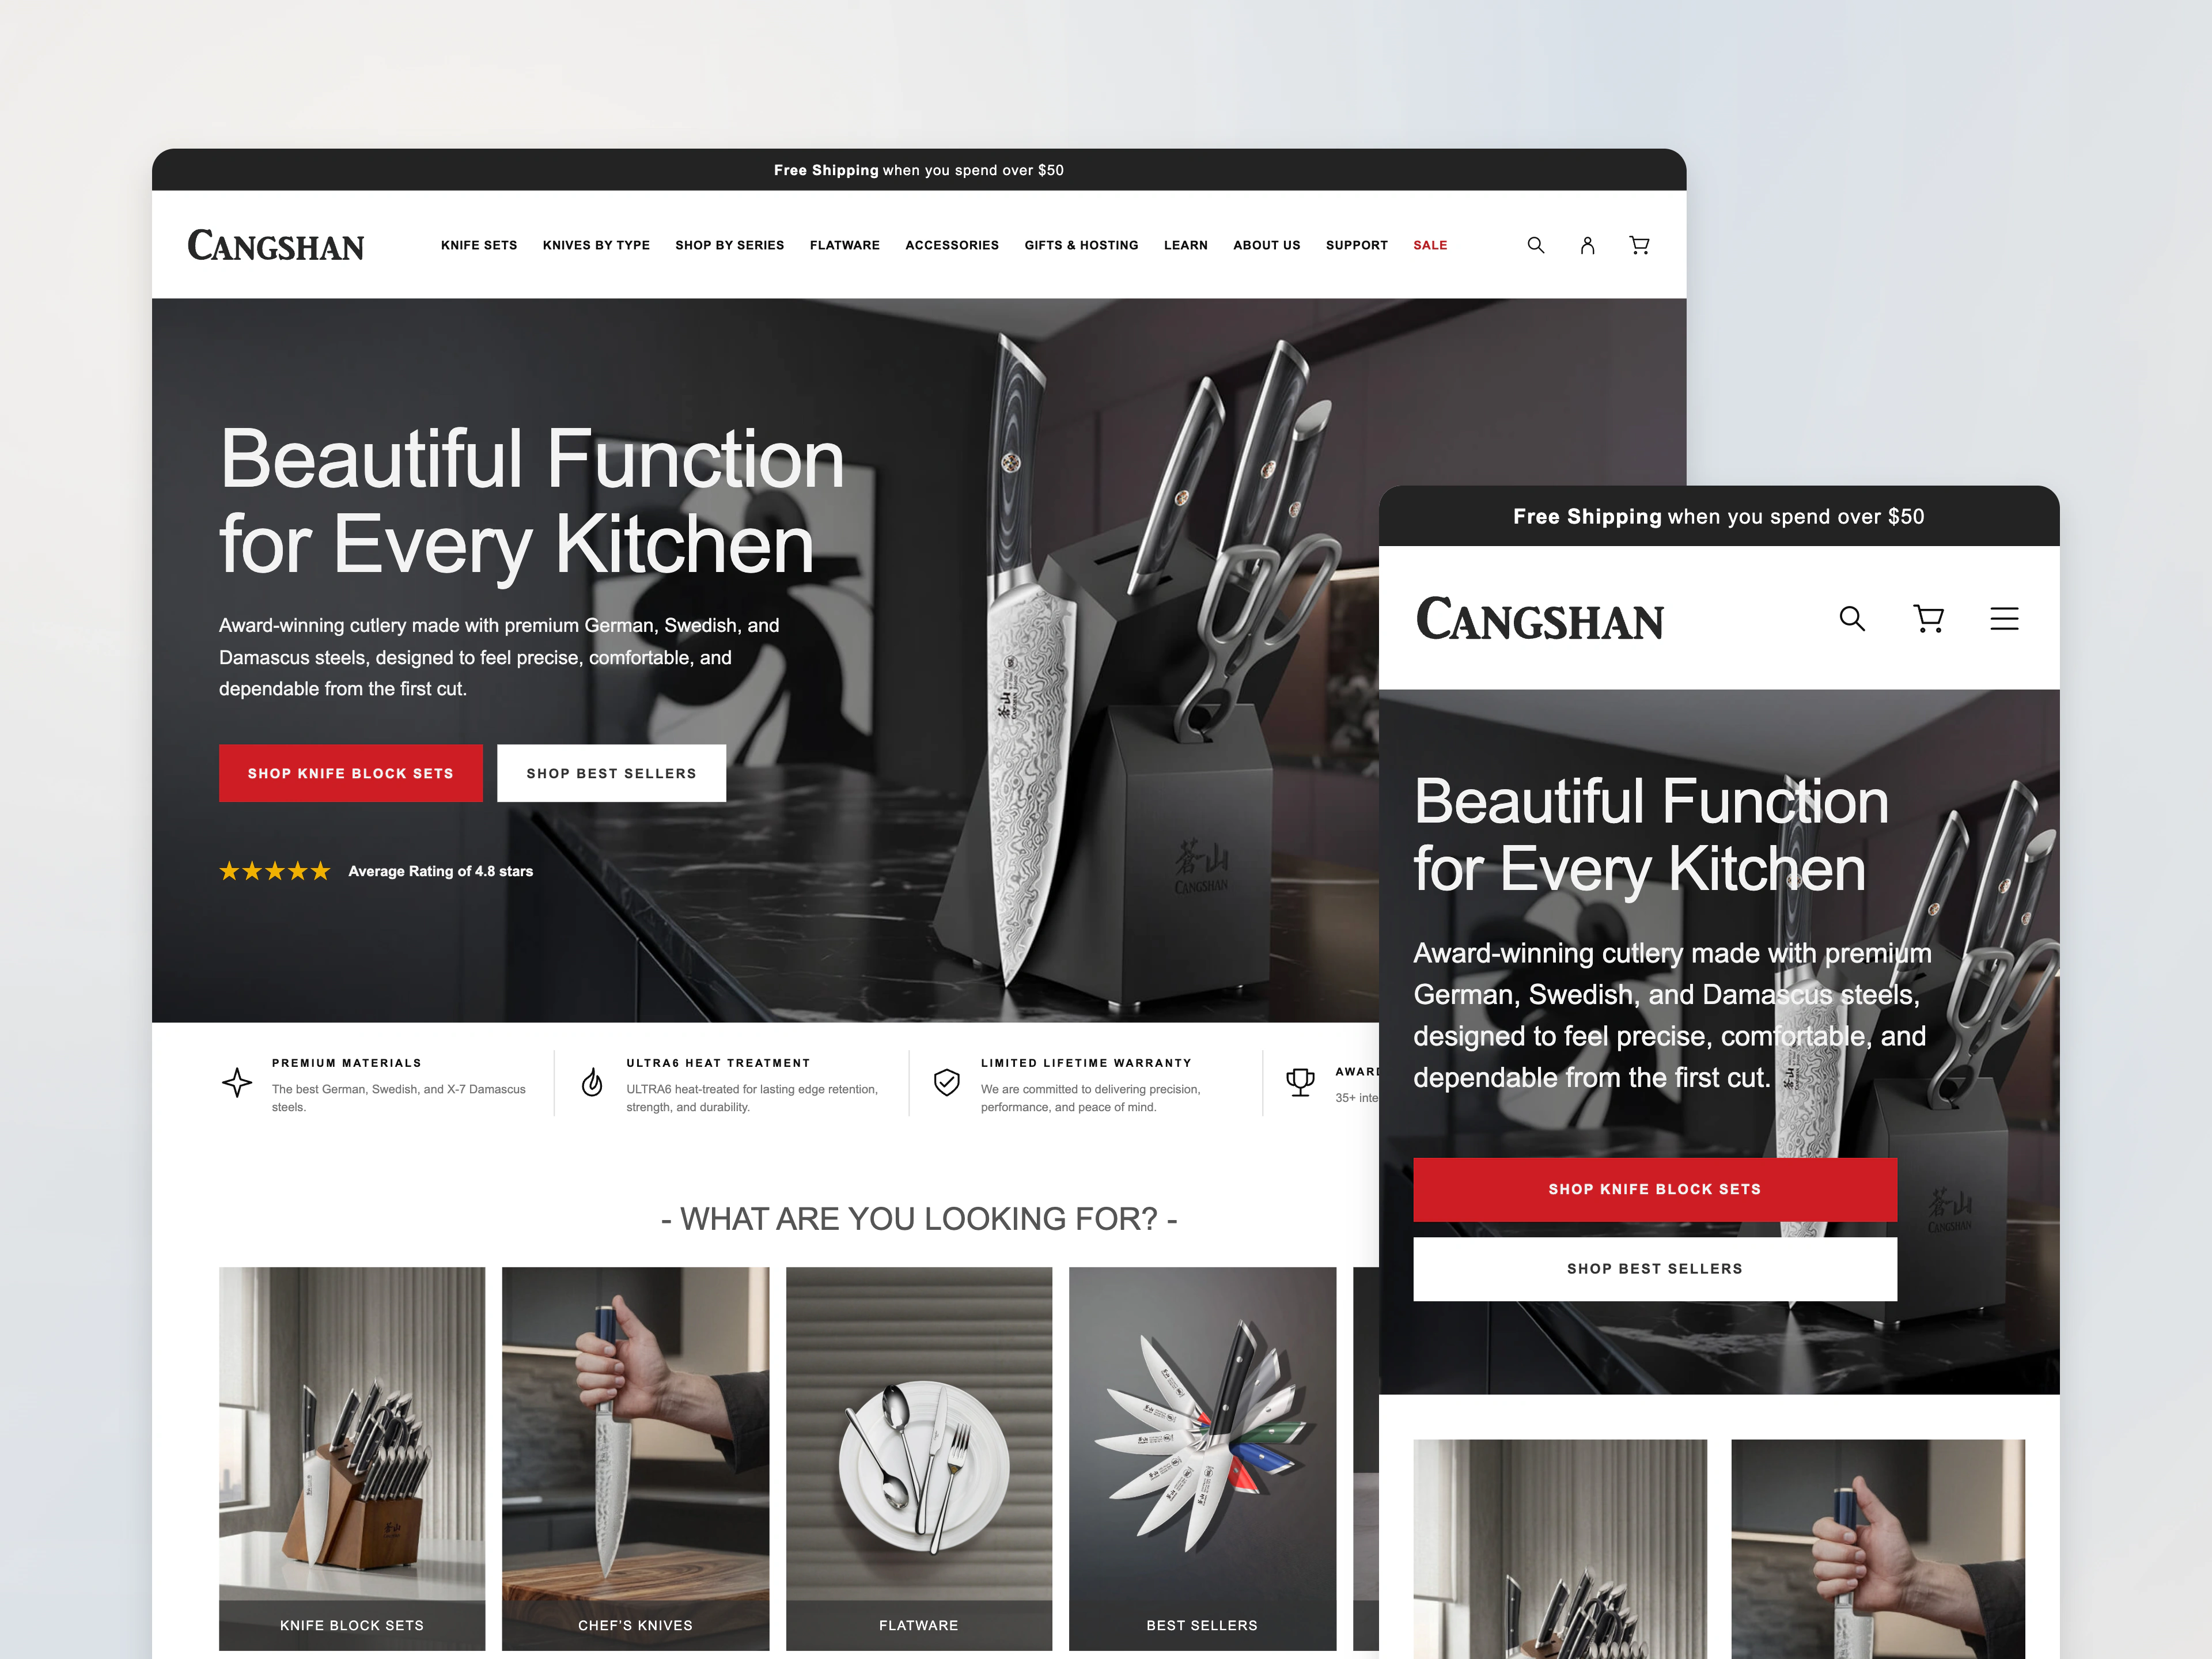
Shoppers choosing a Cangshan knife set compare materials, construction and what each set includes. We planned the Shopify conversion work around that comparison: clearer paths into the catalog, product pages that answer the questions shoppers ask, and a storefront the marketing team can manage more easily. In the 30 days after the August 11, 2026 launch, more shoppers bought, even though fewer visited.
Results snapshot
August 11 to September 9, 2026, compared with July 11 to August 10, 2026.
- Conversion rate
- +39.6%
- Net sales
- +23.8%
- Add-to-cart rate
- +30.2%
- Sessions
- −21.4%
Conversion rate here is the share of sessions that completed checkout. The 39.6% is a relative increase, or 0.41 percentage points.
About Cangshan
Founded in 2015, Cangshan makes premium kitchen cutlery for home cooks and culinary professionals. Its catalog includes individual knives and knife block sets, and each product series differs in materials, construction, design and set contents.
The challenge: a detailed catalog that was hard to compare
Cangshan’s product details are what set its series apart. The project brief asked for clearer paths through the catalog and product pages that explain specifications, materials and what each set includes. For someone choosing between knife block sets, those details answer the real question: which set fits my kitchen?
The storefront itself was also holding the team back. An earlier modernization brief found that the store still ran on a 2020 theme architecture. The marketing team needed reusable Shopify sections so it could manage storefront content more easily.
Before launch, 3.70% of sessions added something to the cart, 2.22% started checkout, and 1.02% completed a purchase. Those figures showed where shoppers dropped off. They didn’t show why.
Our approach: fix the foundation and the buying decision together
We scoped the work in two layers:
- Technical foundation: theme modernization, an inventory of the store’s code and scripts, image-loading improvements, and analytics validation in GA4, with Lighthouse comparisons before and after.
- Shopping experience: the homepage, navigation, collection pages and product pages.
Doing both together meant the store would be easier for the team to run and the catalog easier for customers to understand.
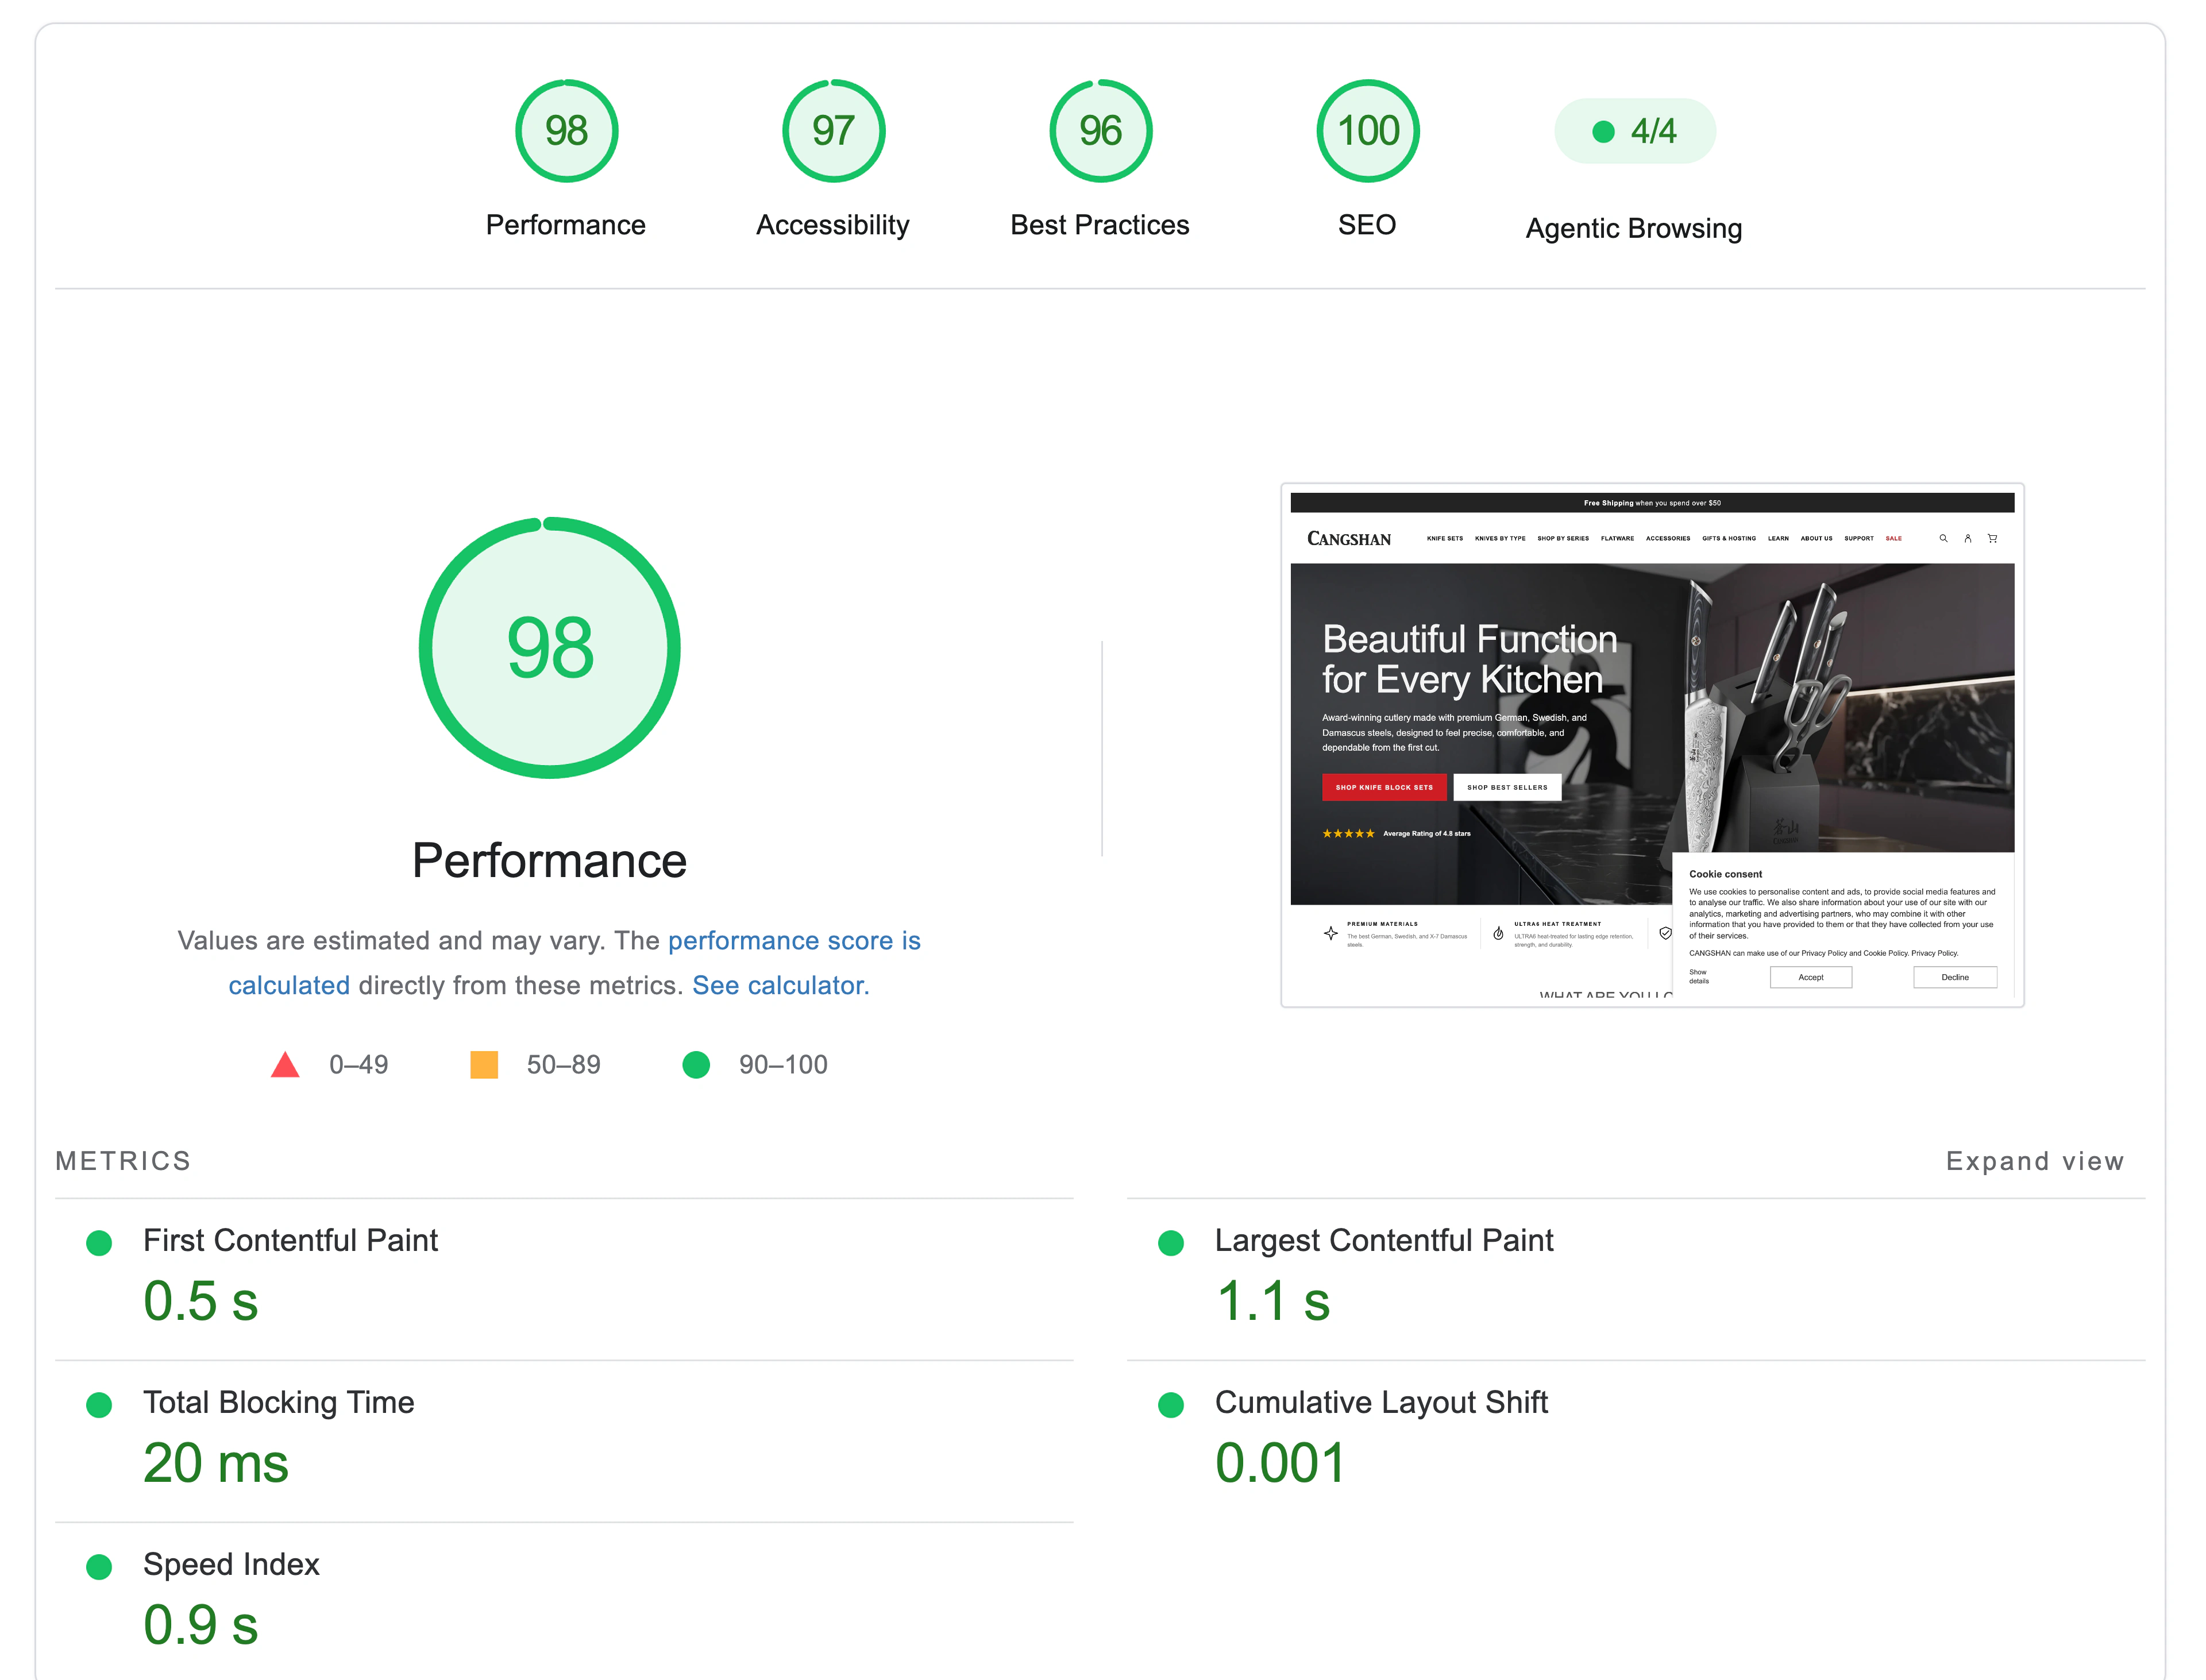
Performance snapshot supplied for this case study.
What we changed
Homepage and navigation. We rebuilt the path from discovery to purchase across the homepage and navigation. The goal: give shoppers clearer starting points and shorter paths to the right product category.
Collection pages and filters. We added Shopify’s built-in filters, powered by structured product data. The goal: let shoppers narrow the catalog by the attributes that matter to them, instead of opening products one at a time.
Product pages and knife block sets. We built reusable knife series data, written once and shown wherever that series is sold, plus a dedicated template for knife block sets that lays out specifications, materials and set contents. The goal: put the information shoppers need to compare products right next to the buy button.
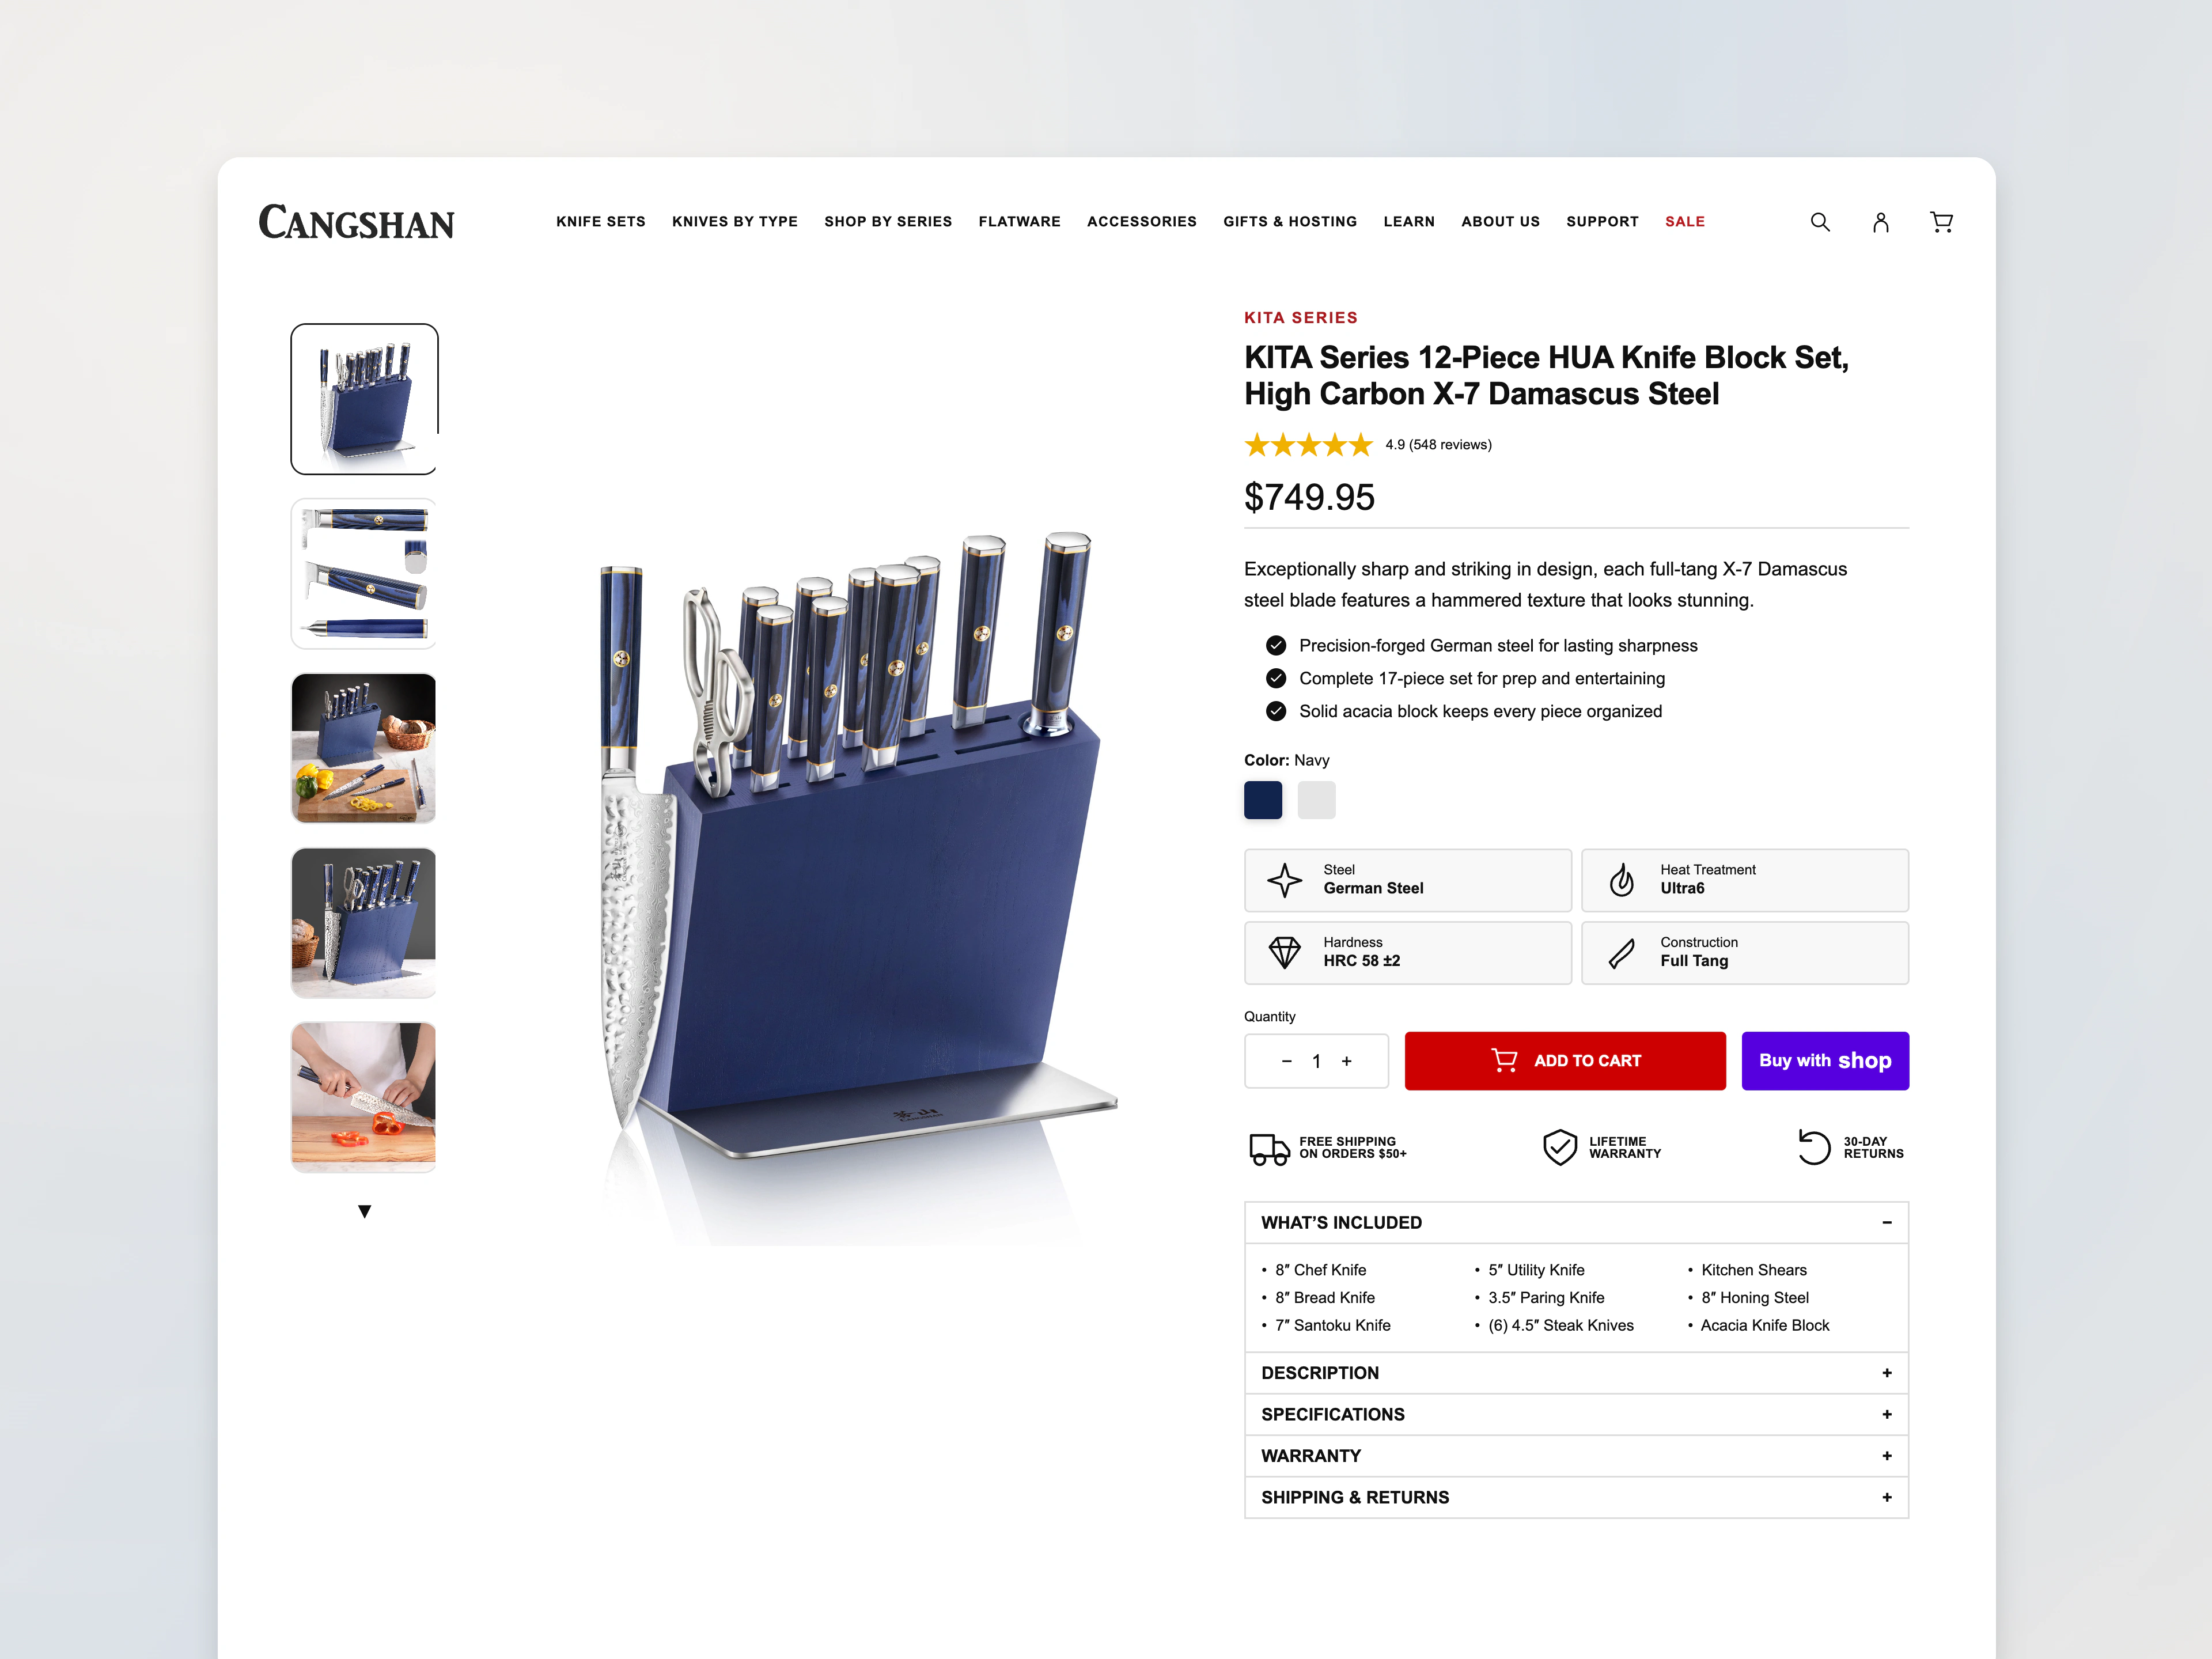
Product details, specifications and set contents alongside the buy button.
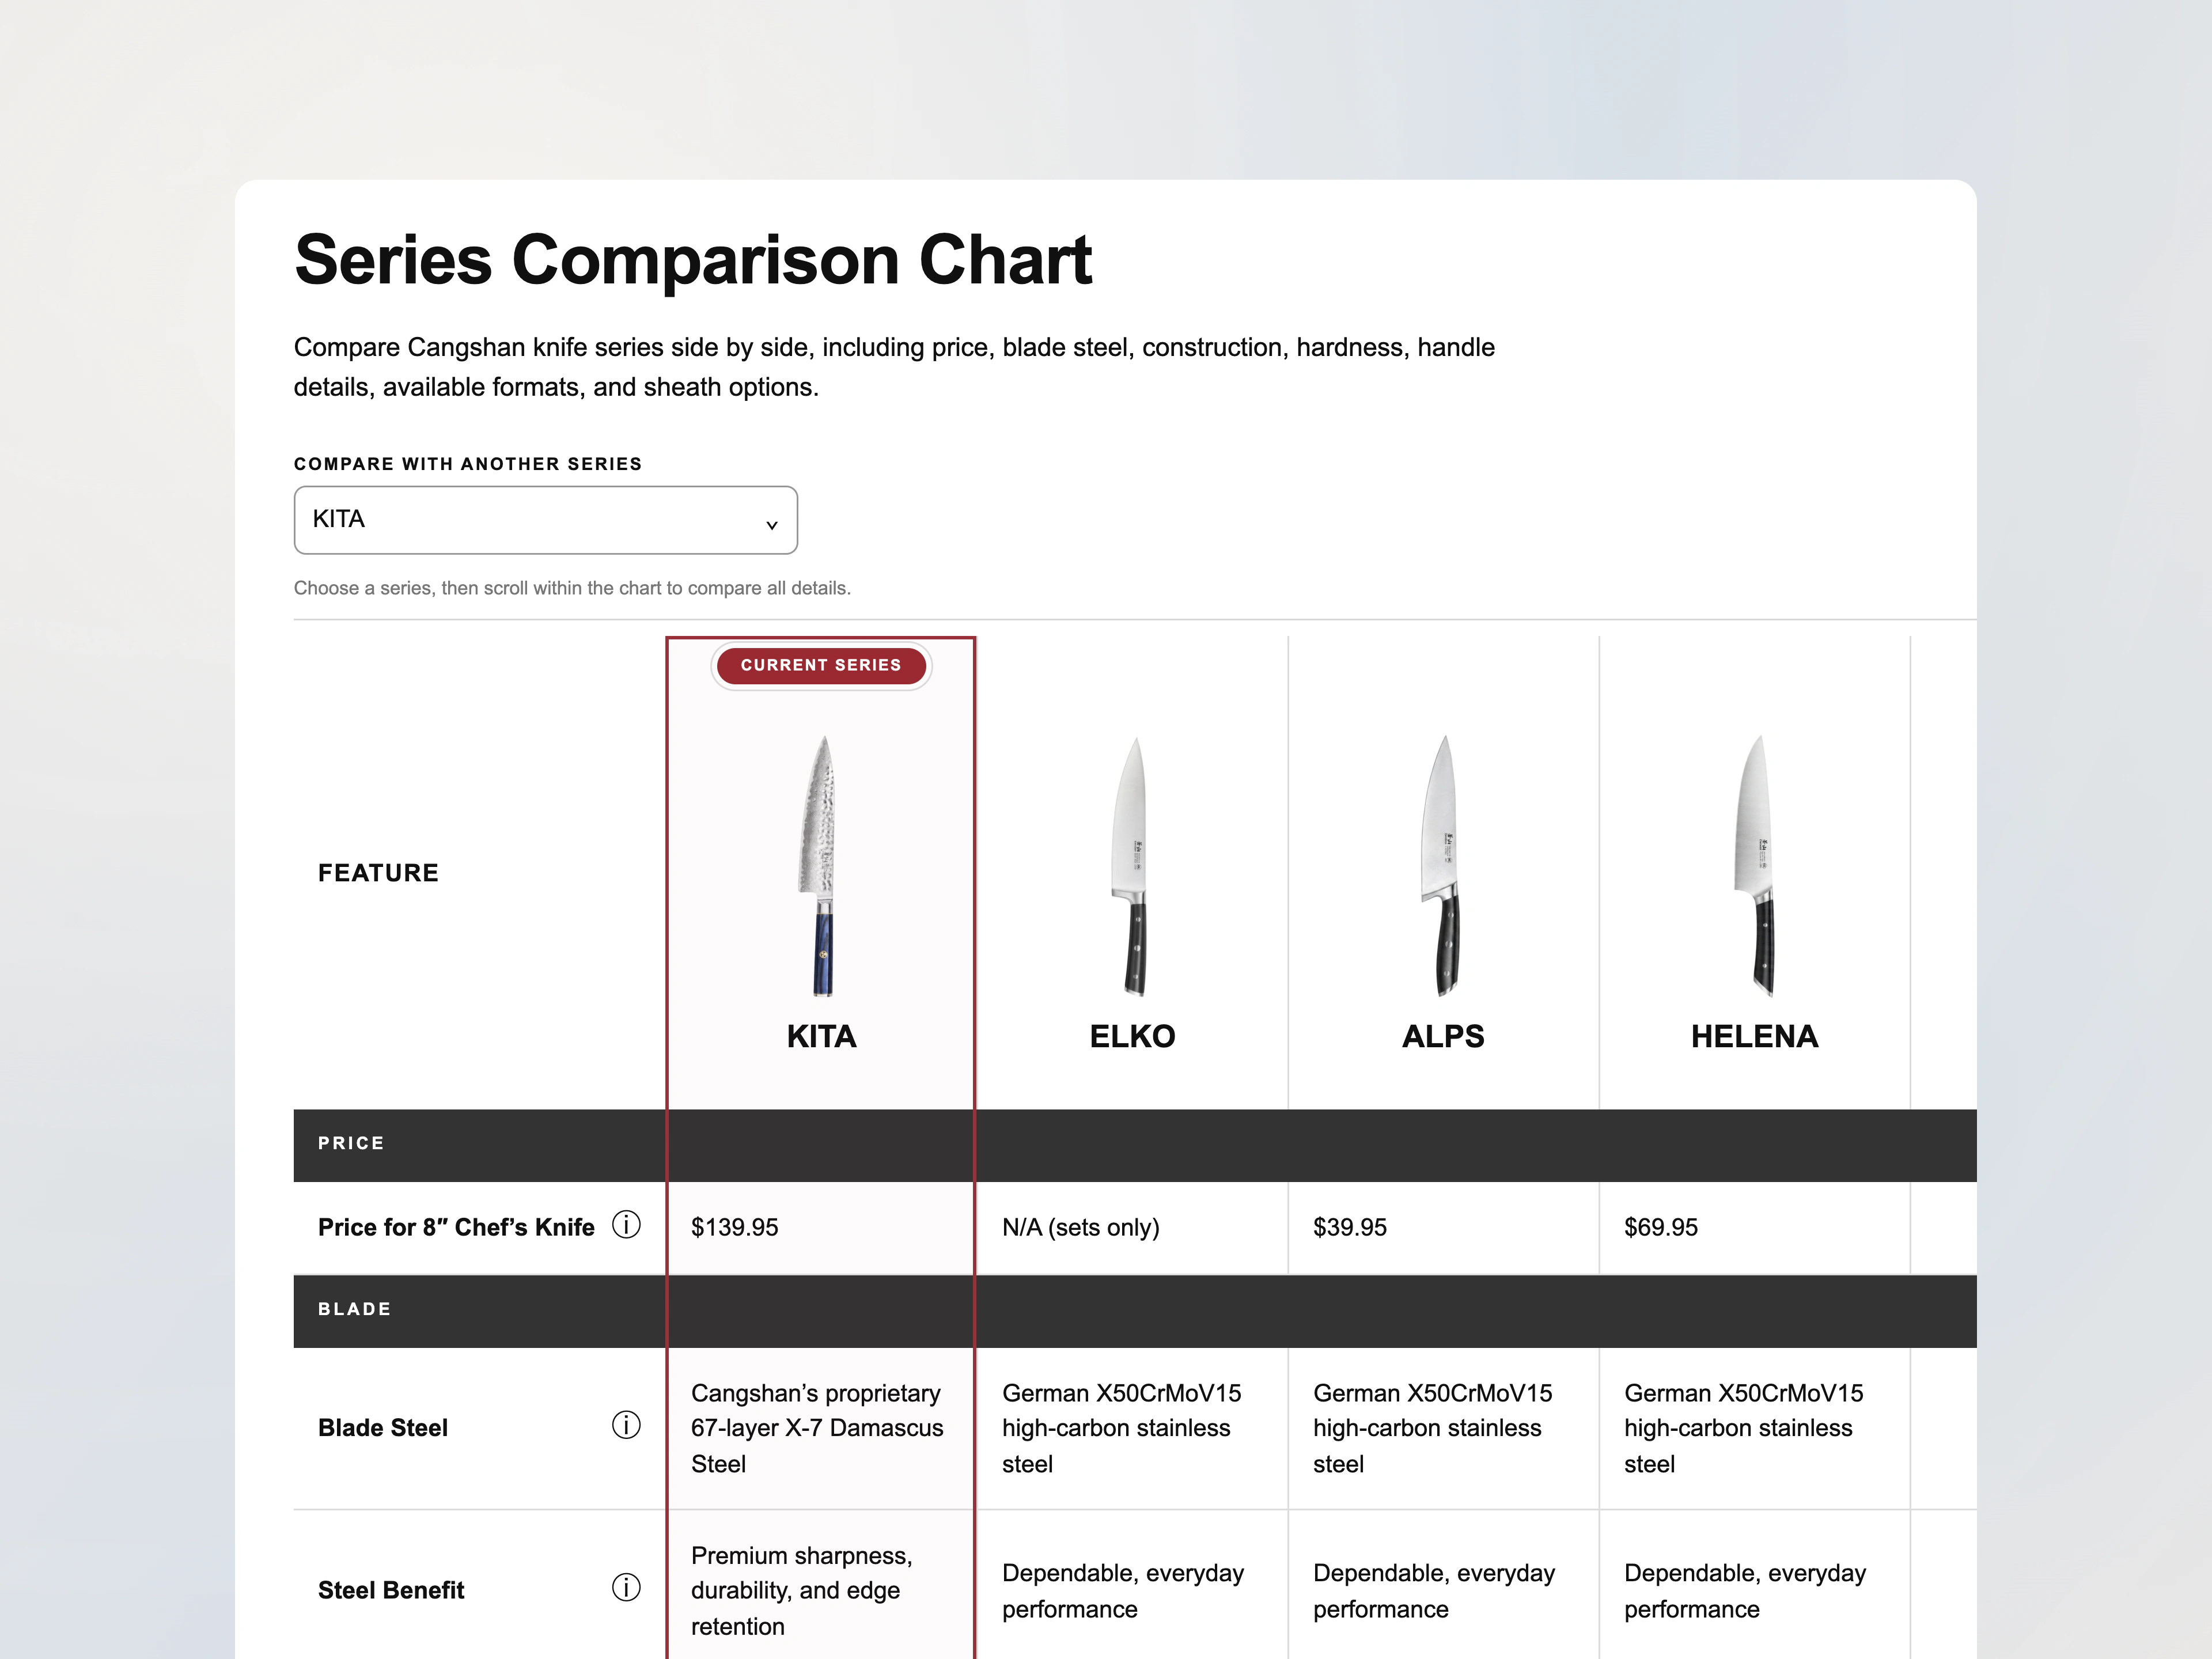
A side-by-side series comparison helps shoppers understand the differences.
Also in the project scope. The list below reflects the project scope. Not every item may have shipped in the August 11 launch.
- Theme flexibility and performance: Online Store 2.0 templates and reusable sections, removing unneeded scripts, and responsive images, to give marketing more control and cut the code and image weight that slow pages down.
- Checkout and tracking: checkout modernization, tracking on Shopify Customer Events and Web Pixels, and GA4 validation, to keep integrations on Shopify’s supported tools and make purchase data more reliable.
The results: more sales from fewer visits
We compared Shopify data for the 30 days after launch (August 11 to September 9, 2026) with the 31 days before it (July 11 to August 10, 2026). Funnel metrics are session-based.
Traffic fell 21.4%, from 22,161 to 17,415 sessions. Sales still grew. Online Store orders rose from 388 to 439, and net sales grew 23.8%.
More shoppers moved toward purchase at each early step. The share of sessions that started checkout rose from 2.22% to 3.58%, up 61.1%. Sessions that completed checkout rose from 227 to 249. (These are session counts, so they differ from the order count in the sales report.)
That pattern fits what the project set out to do: help shoppers find and compare products. It doesn’t show which individual change did the most.
Not everything improved. Conversion for sessions that landed on the homepage fell from 1.33% to 0.94%. Checkout conversion, the share of checkout starts that finished, fell from 46.14% to 39.97%. Both are next on the list to investigate.
How to read these numbers
This is a before-and-after comparison, not an A/B test. Traffic mix, discounts and product mix also changed between the two periods. Because the project included tracking repairs, part of the change could come from measuring differently rather than from shoppers behaving differently.
Percentages are calculated from unrounded Shopify data, so they may differ slightly from calculations using the rounded figures shown.
Key takeaways
- Make comparison easy. When products differ in the details, put specifications and set contents where shoppers decide.
- Measure the whole funnel. More checkout starts can arrive alongside a lower checkout completion rate, and both matter.
- Keep going after launch. Conversion work should follow the gaps that remain.
Find your store’s next conversion opportunity
We’ll find where shoppers lose momentum on your store and help you prioritize the storefront changes most likely to turn that into sales. Book a free 20-minute call, or start with the Shopify CRO Audit.